Fifty Proceedings
What 1,528 OSDI and SOSP papers say about how systems research changed
I am interested in how OSDI and SOSP have changed over the past five decades, so I built a census of them: every refereed paper at both conferences, 1967 to 2025—50 editions, 1,528 papers, 7,919 author slots. Data and scripts are on GitHub.
Briefly, on where the numbers come from. OSDI came from usenix.org proceedings and program pages; SOSP had to be assembled from sigops.org, the per-year conference websites, Crossref, OpenAlex and a non-truncating DBLP mirror, because ACM’s Digital Library blocks automated access outright. Every one of the 50 editions had its paper count checked against an independent source: 49 matched on the first pass, and OSDI 2023 turned out to be missing its five tail papers, which were recovered. Where data simply does not exist—98 pre-1990 papers carry no affiliation—the years are marked under the axis in the figures below.
The program tripled; the teams grew faster
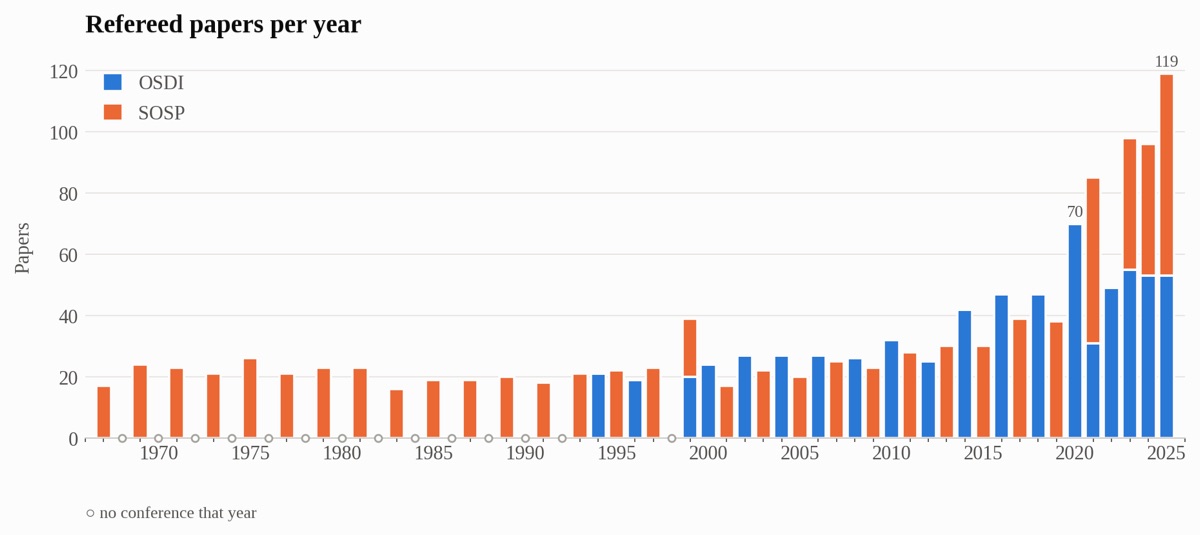
For its first three decades, this field published about twenty papers a year. That line is almost perfectly flat from 1967 to 1999—a stable community with a stable output. Then, after 2020, it goes nearly vertical: the combined program grew from 32 papers in 2010 to 119 in 2025. Behind the last few bars is a structural change: both venues gave up the alternating-year rhythm that organized this community for half a century. OSDI has been held every year since 2020, SOSP every year since 2023. Add the single largest edition in the corpus—OSDI 2020, with 70 papers—and what used to be one conference a year is now two, running in parallel.
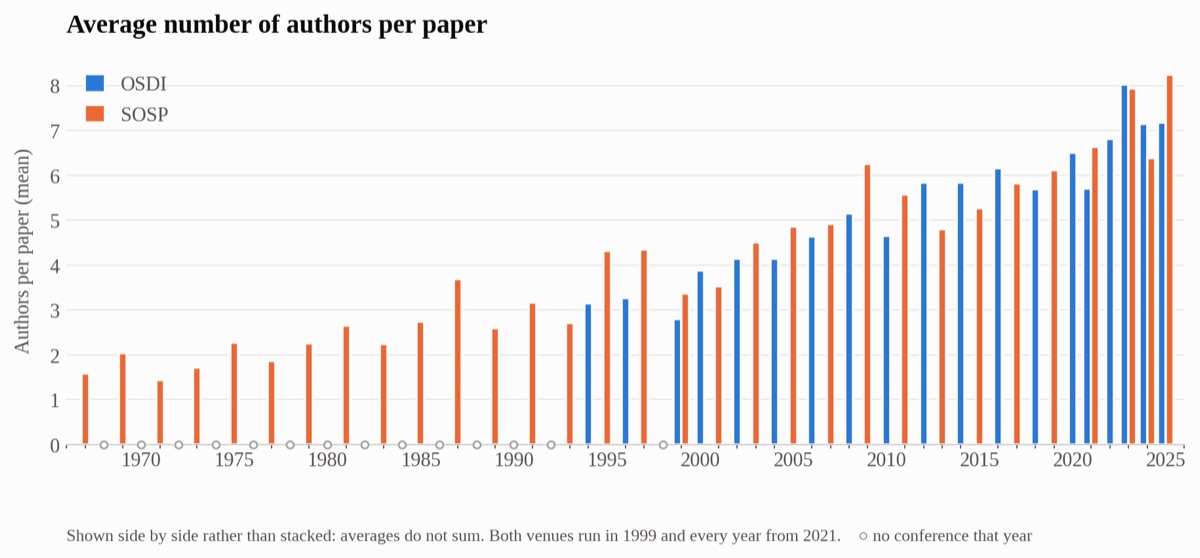
Team size rose in parallel, and the starting point is the surprise: papers averaged 1.6 authors in the late 1960s—most of this field’s founding work was written by a small group—against 8.2 at SOSP 2025. Put the two figures together and you get the number I find most striking in the whole set. Between 2010 and 2025 the program grew 3.7 times—but the number of author slots grew 6.2 times, from 149 to 924. The field is not just publishing more papers. It is spending disproportionately more people per paper, which is the same trend I wrote about from the other direction.
More institutions in the room
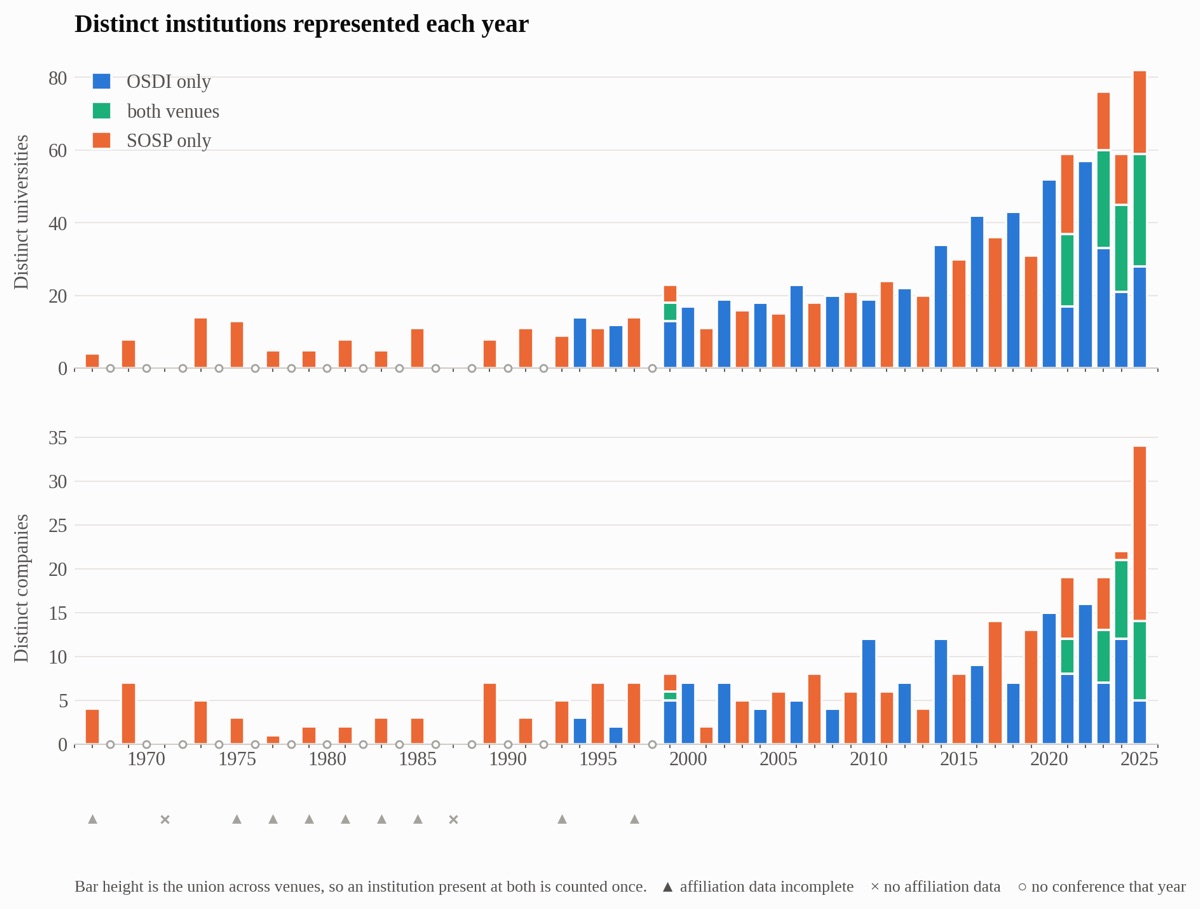
In 2025, OSDI drew on 60 universities and SOSP on 55; 31 were the same places, so 84 distinct universities appeared on the program—against about a dozen through the 1980s. The lower panel is the more interesting one. The number of distinct companies sat between five and fifteen for two decades, then roughly doubled in the last five years, reaching 34 in 2025.
Universities can no longer do it alone
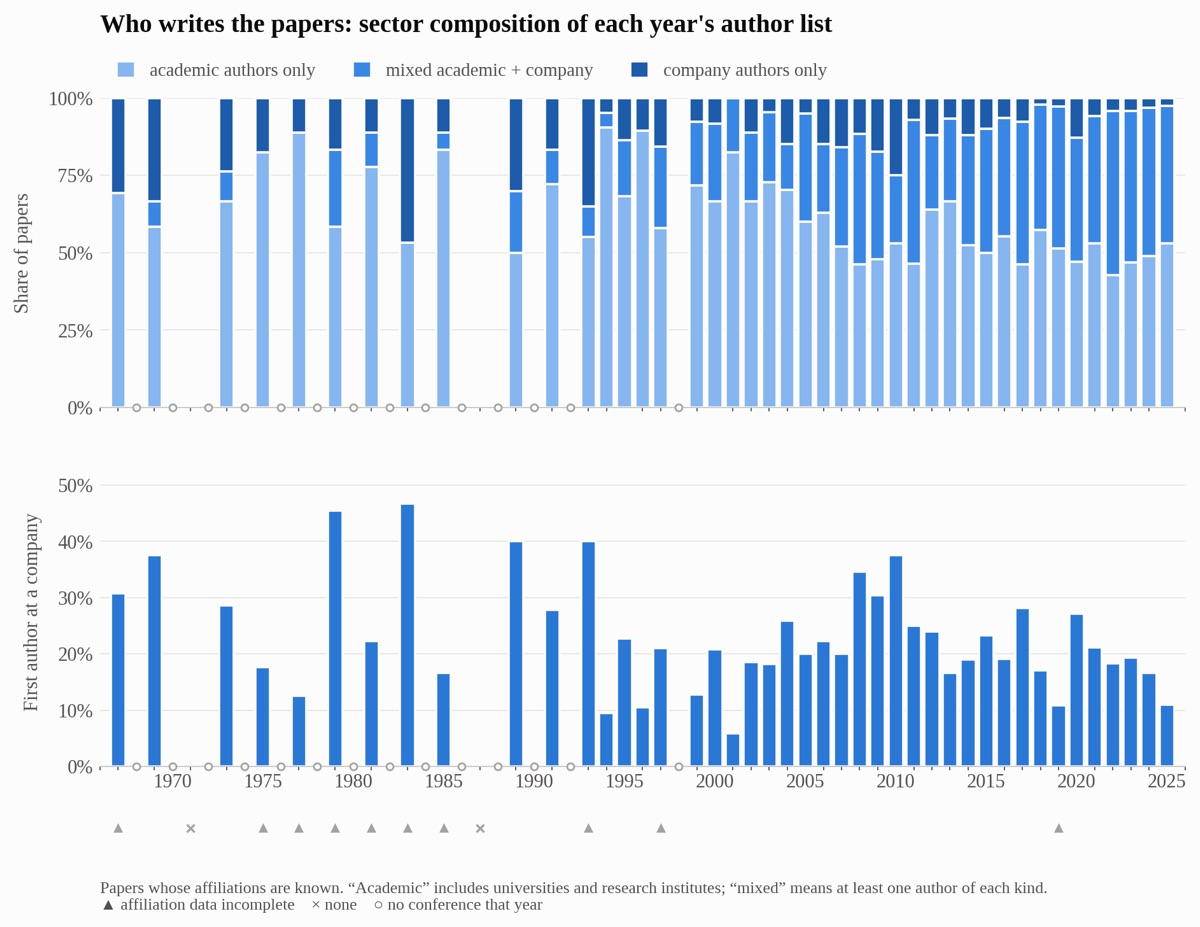
Papers with both academic and company authors went from 13% of the program in the 1990s to 27% in the 2000s, 37% in the 2010s and 46% in the 2020s. I read that as a statement about where systems problems now live. A university on its own increasingly has neither the problem nor the machine: the workloads worth studying run at fleet scale, and the hardware that runs them sits inside companies.
Two thirds of the names are new, every year
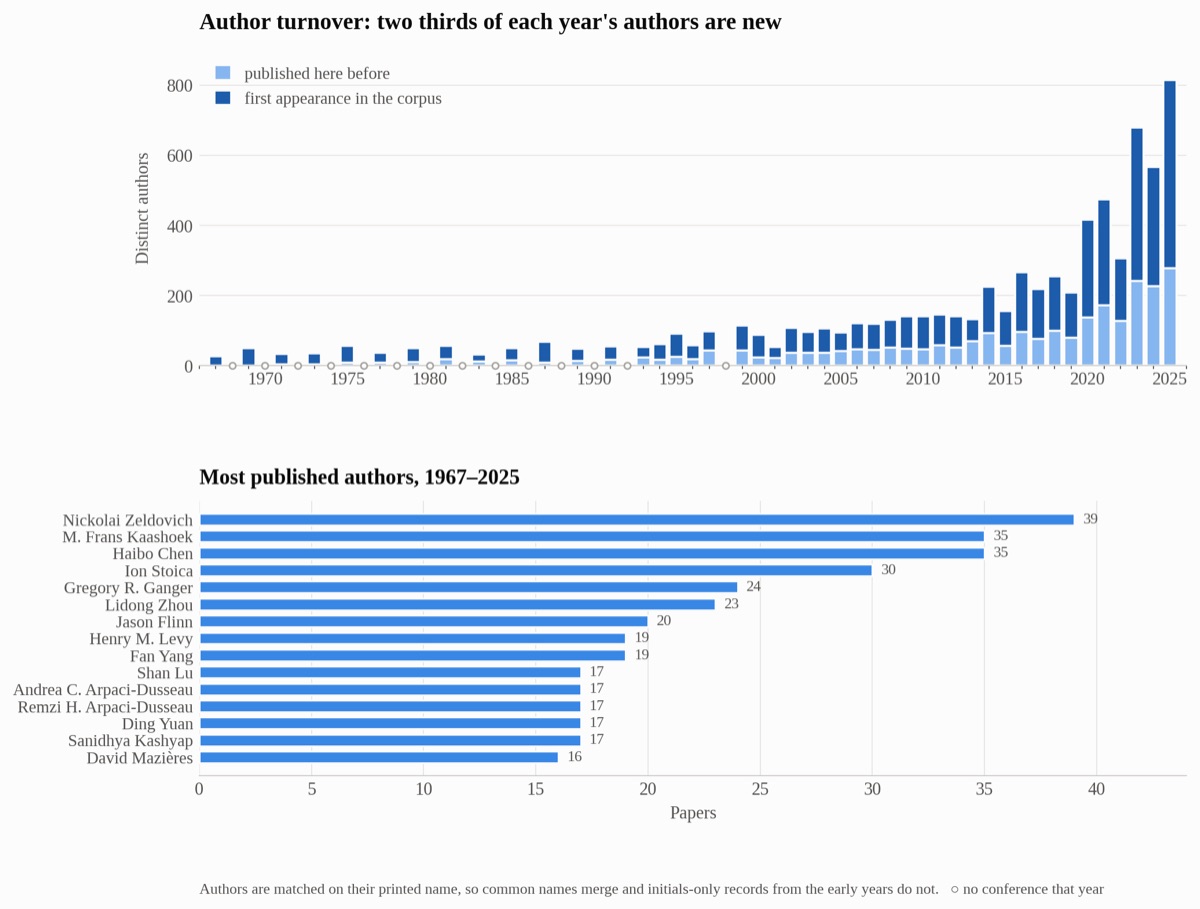
The newcomer share has hovered near two thirds for thirty years—65% in the 1990s, 63% in the 2020s—even as the program tripled. That is the healthiest number in this study: the community grew without becoming a closed shop. The bottom panel names the other tail, the people who keep coming back, with Nickolai Zeldovich at 39 papers, Frans Kaashoek and Haibo Chen at 35, Ion Stoica at 30. One disclaimer: authors are matched literally, on the printed name string, with no disambiguation of any kind.
The head is as strong as ever; the tail grew faster
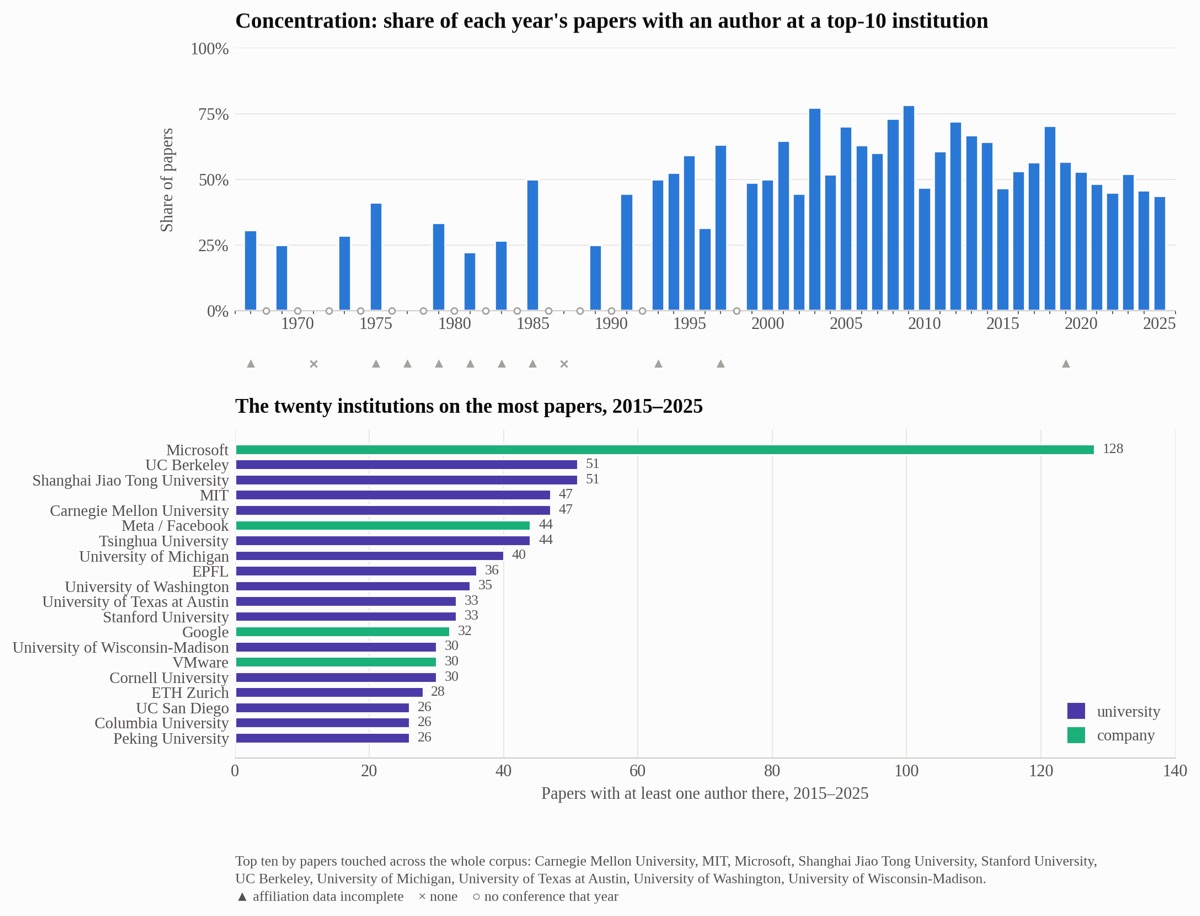
Fix the ten institutions that appear on the most papers corpus-wide, and their share of the program peaked at 78% in 2009 and has fallen to 44% in 2025. This is not decline: those places publish more papers than ever. The denominator simply grew faster than they did. The lower panel shows how lopsided the head still is: Microsoft appears on 128 papers between 2015 and 2025, and no other institution reaches sixty.
Where the authors are
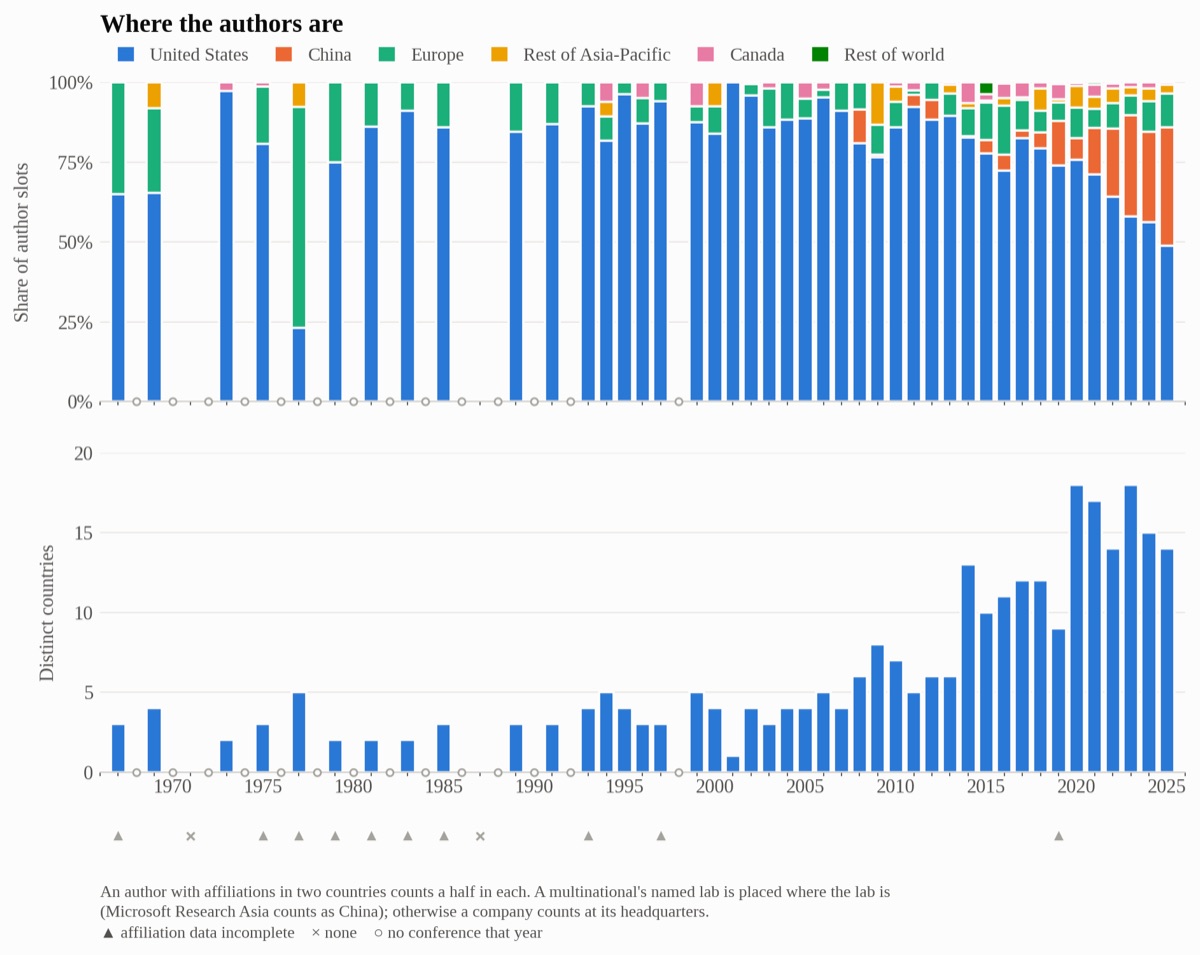
This is the fastest-moving chart in the set. The United States supplied roughly 89% of author slots through the 1990s and 2000s, and 49% in 2025—the first year it was not a majority. Mainland China and Hong Kong went from essentially nothing before 2010 to 37% in 2025. The number of countries on the program rose from three or four in the 1990s to eighteen in 2023. One caveat: 632 of Microsoft’s 886 author slots read simply “Microsoft Research” with no location and default to the United States, so the US share here is slightly overstated.
Papers ship named systems now
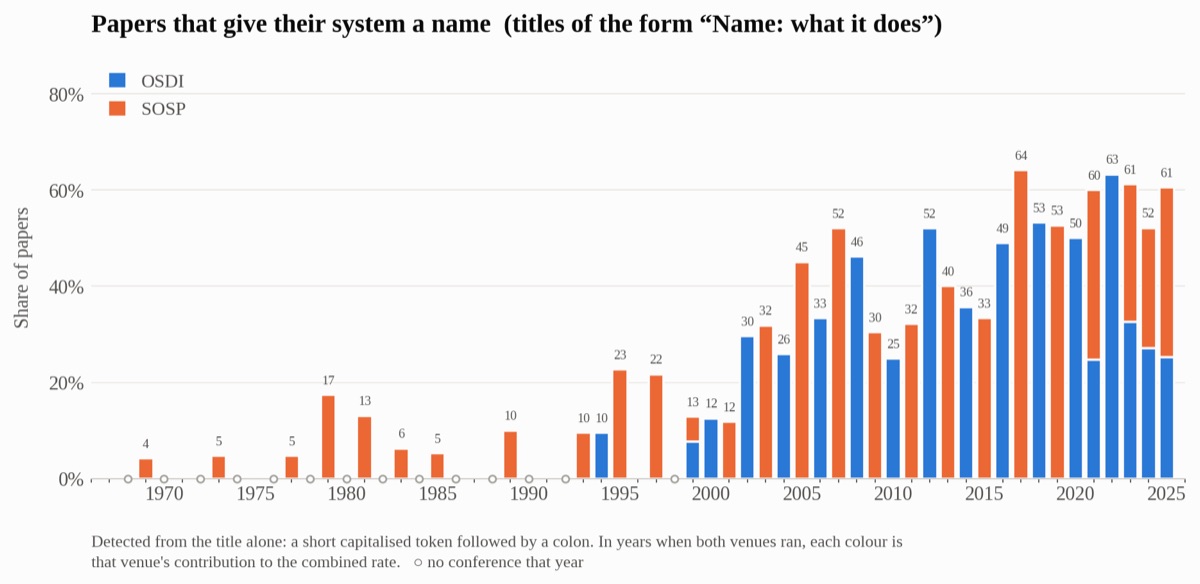
Count the titles of the form “Name: what it does” and you get a proxy for what a paper thinks it is delivering. Naming went from 11% of papers in the 1990s to 32% in the 2000s, 44% in the 2010s, and 58% in the 2020s. A technique gets described; an artifact gets named. I will admit a personal dislike here: the convention has hardened into a cliche, and a title would often serve the reader better by leading with the problem or the contribution.
What the curves suggest
The trend of systems research is obvious: bigger programs, bigger teams, more institutions, more countries, more collaboration across the academia-industry line, and more papers that hand you a named artifact. If the trend lines simply continue, the combined program passes 150 papers within a few years, the average team reaches ten, and the US share keeps sliding below half. None of that is decline. It is a field being scaled up by more people, from more places, than it has ever had.
What I do not see in any of these curves is the machinery that is supposed to absorb that scale. Program committees, reviewing load, the tacit standards that make a “good systems paper”—those were built for the flat part of Figure 1, the twenty-papers-a-year field, and they are now carrying six times the traffic. I have written elsewhere about what that does to reviewing. The optimistic reading of this study is that the community grew without closing its doors: two thirds of the names on the program are new every single year, and that has been true for three decades. The uncomfortable reading is that a field can grow this fast in exactly one way—by admitting more people than it can train, and publishing more work than it can check.
References
- Cheng Tan. OSDI + SOSP paper metadata, 1967–2025. Dataset, figures, and analysis scripts. All numbers and figures in this post come from this repository.